ADVANCED
Advanced Analytics
Deep dive into your data
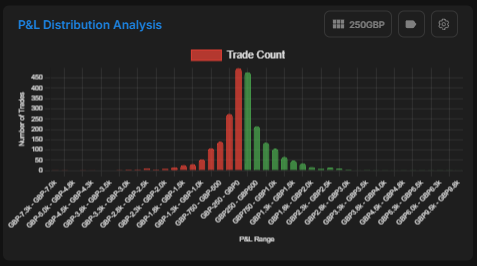
P&L distribution charts with customizable bucket sizes. Interactive charts - click any element to see underlying trades. Multiple timeframes from daily to 1-minute.
Overview
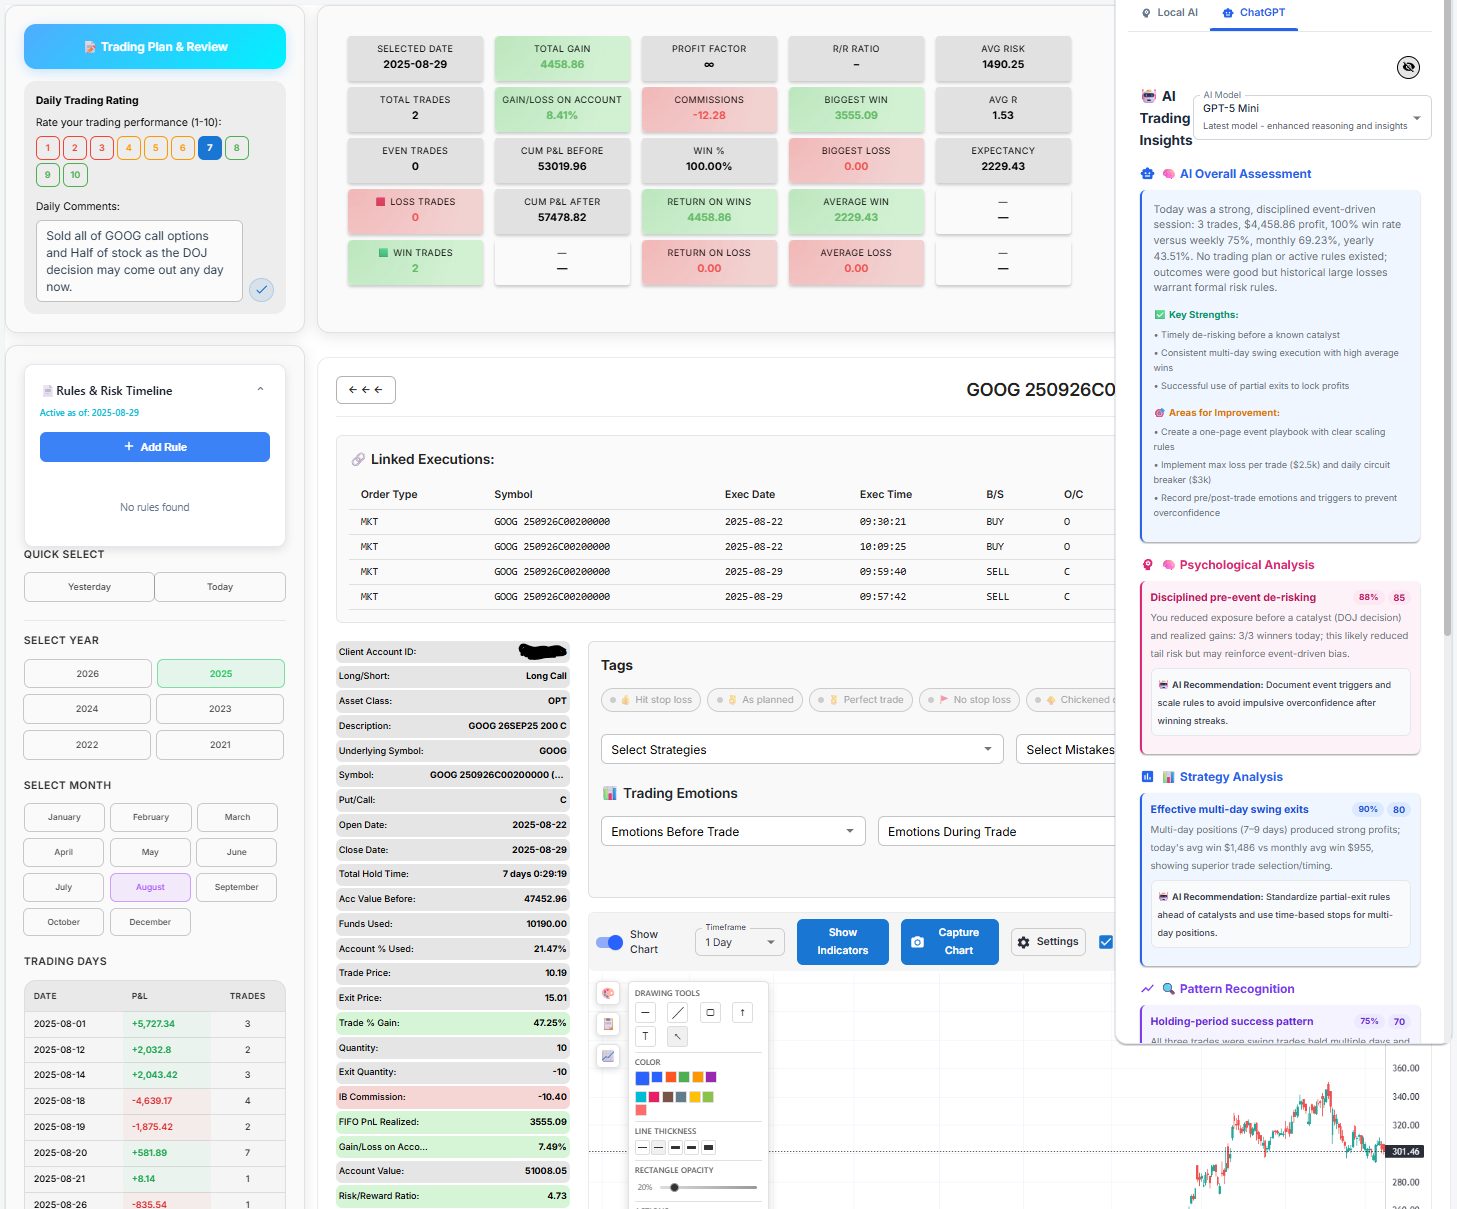
Go beyond basic win/loss ratios. Our Advanced Analytics suite provides probabilistic insights into your trading. Analyze P&L distribution, expectancy across different time windows, and sector-specific performance. Every chart element is clickable, creating an interactive path from high-level statistics down to the specific trades that generated them.
Key capabilities
P&L Distribution
Time-of-Day Analysis
Sector Performance
Interactive Charting
Screenshots
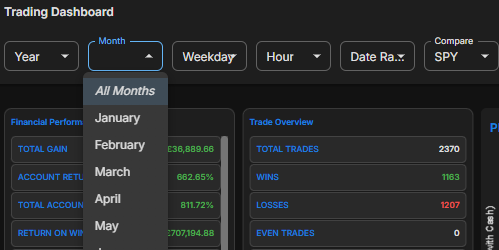
🌙 Dark
Dark mode — strategy comparison and distribution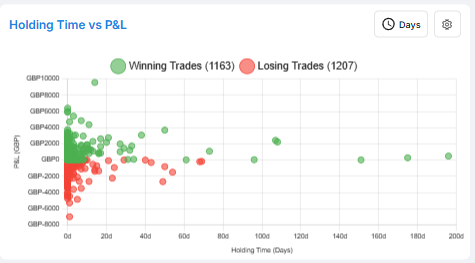
☀️ Light
Light mode — time-of-day heatmap viewExplore more features
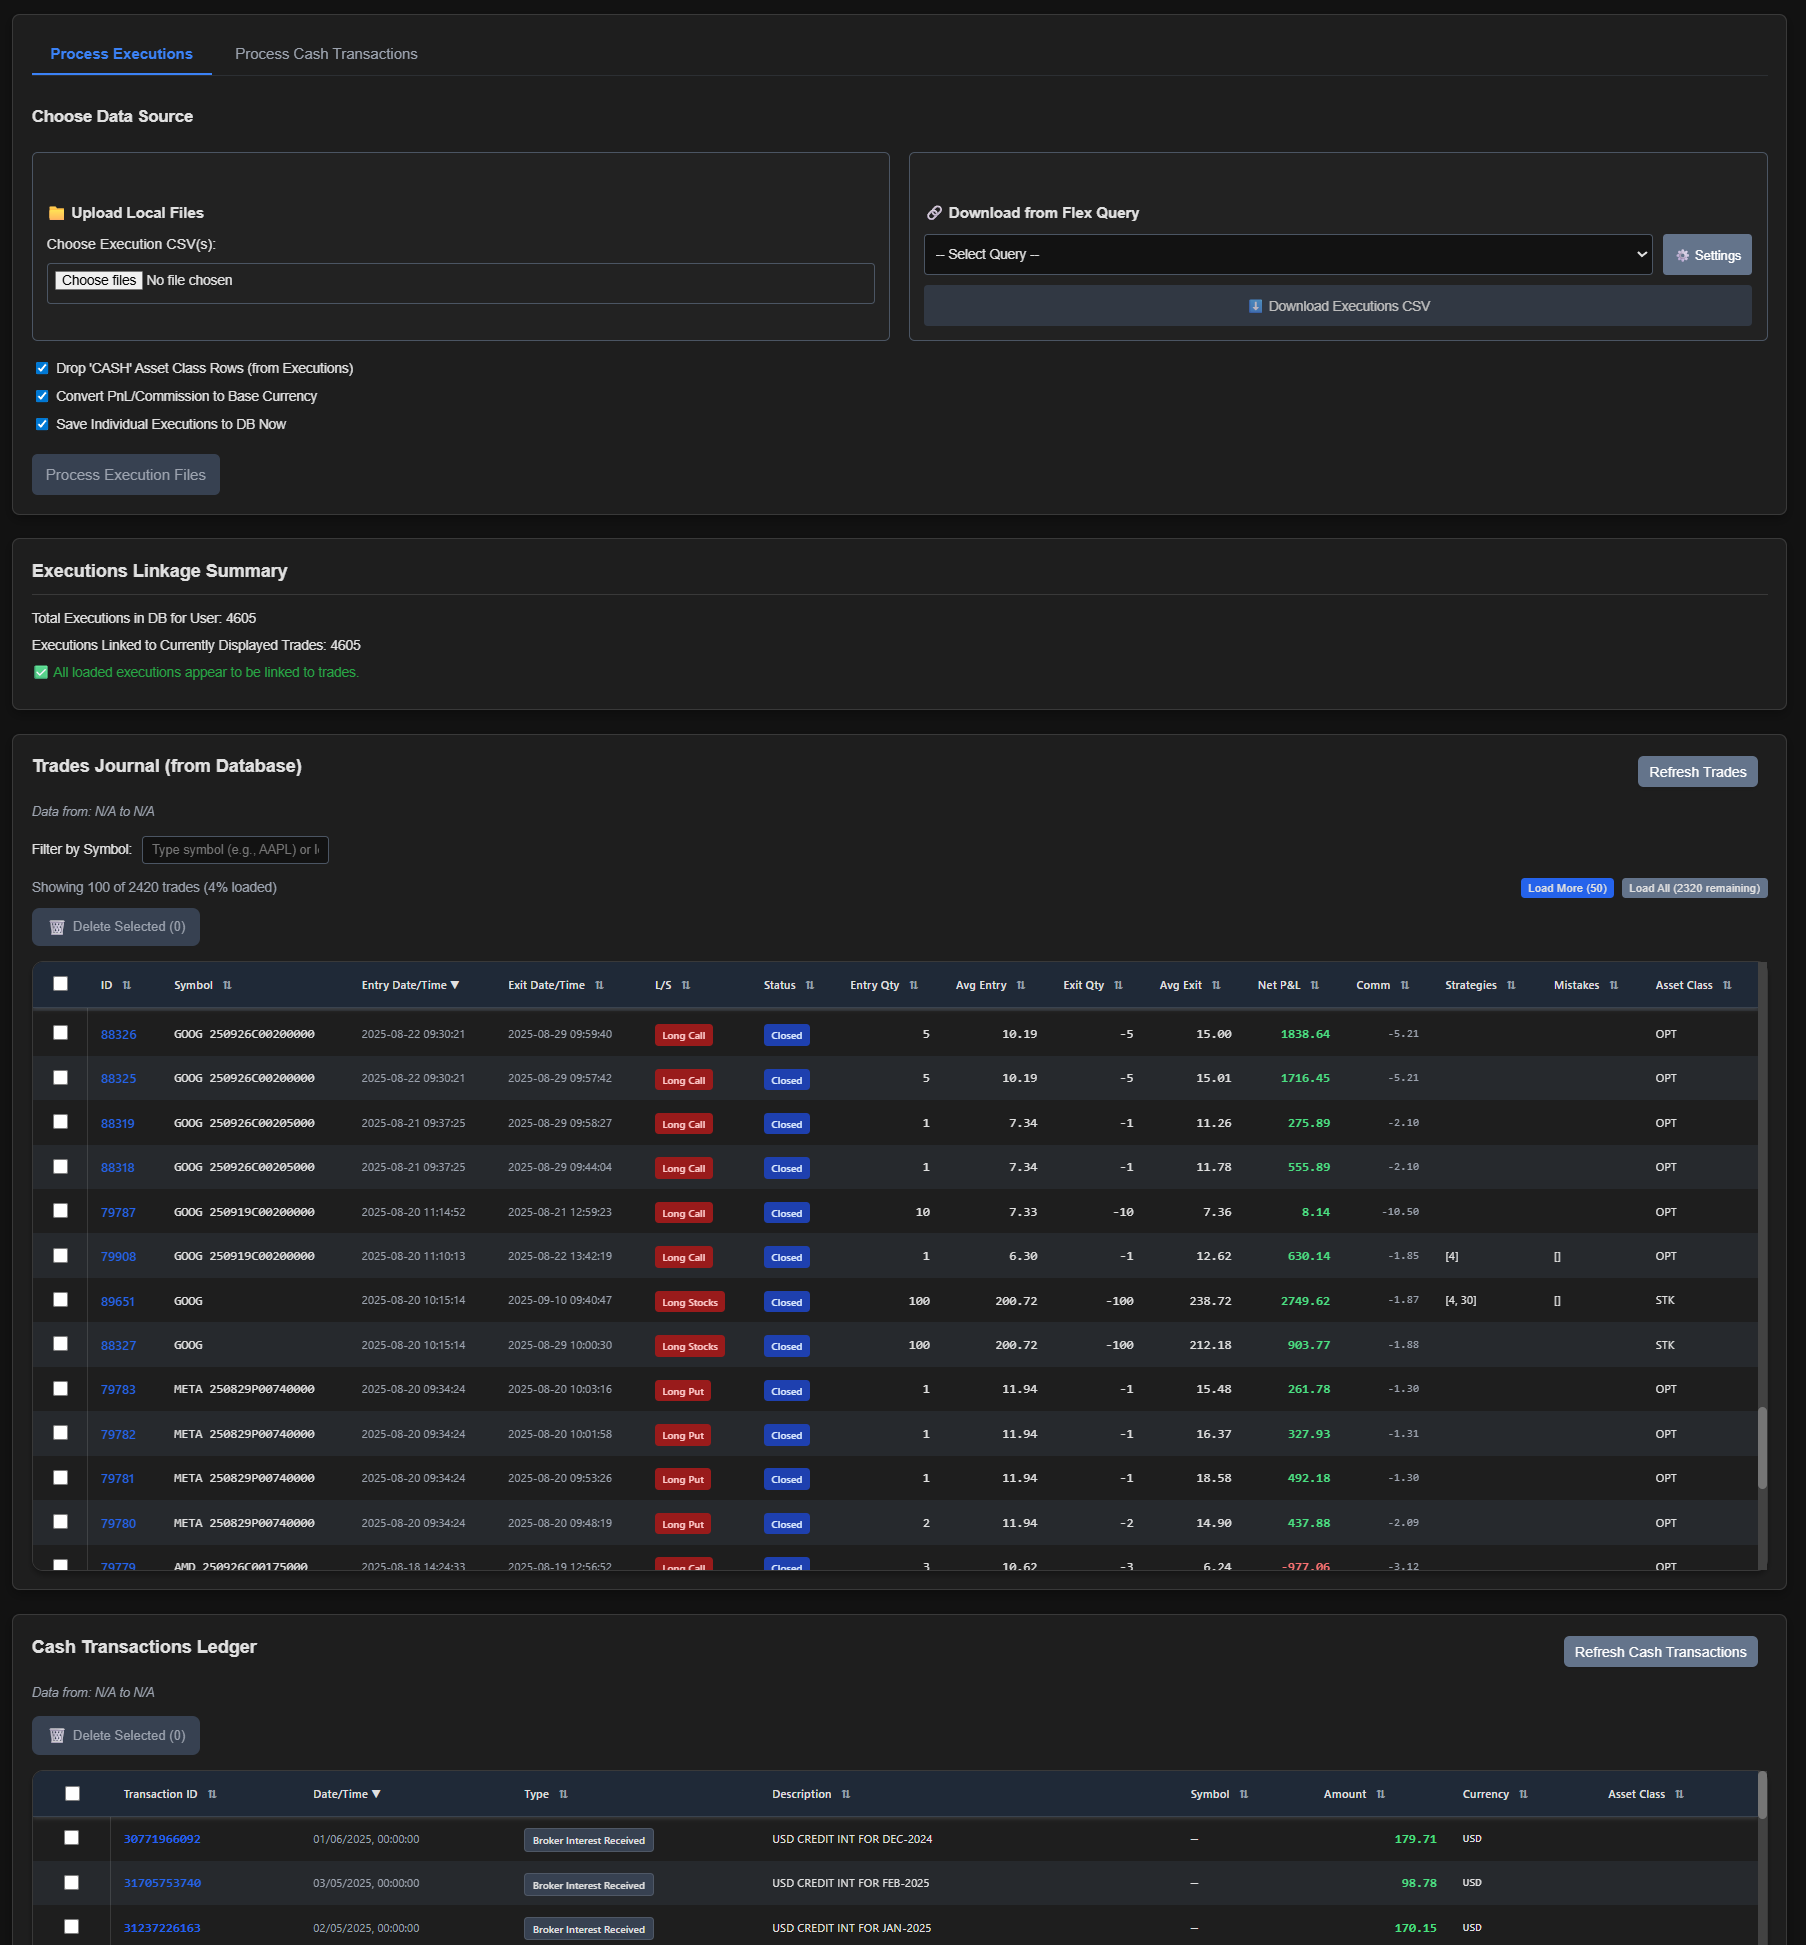
Data Import
Explore
Trade Tables
Explore
Filtering
Explore