CORE FEATURE
P&L Calendar
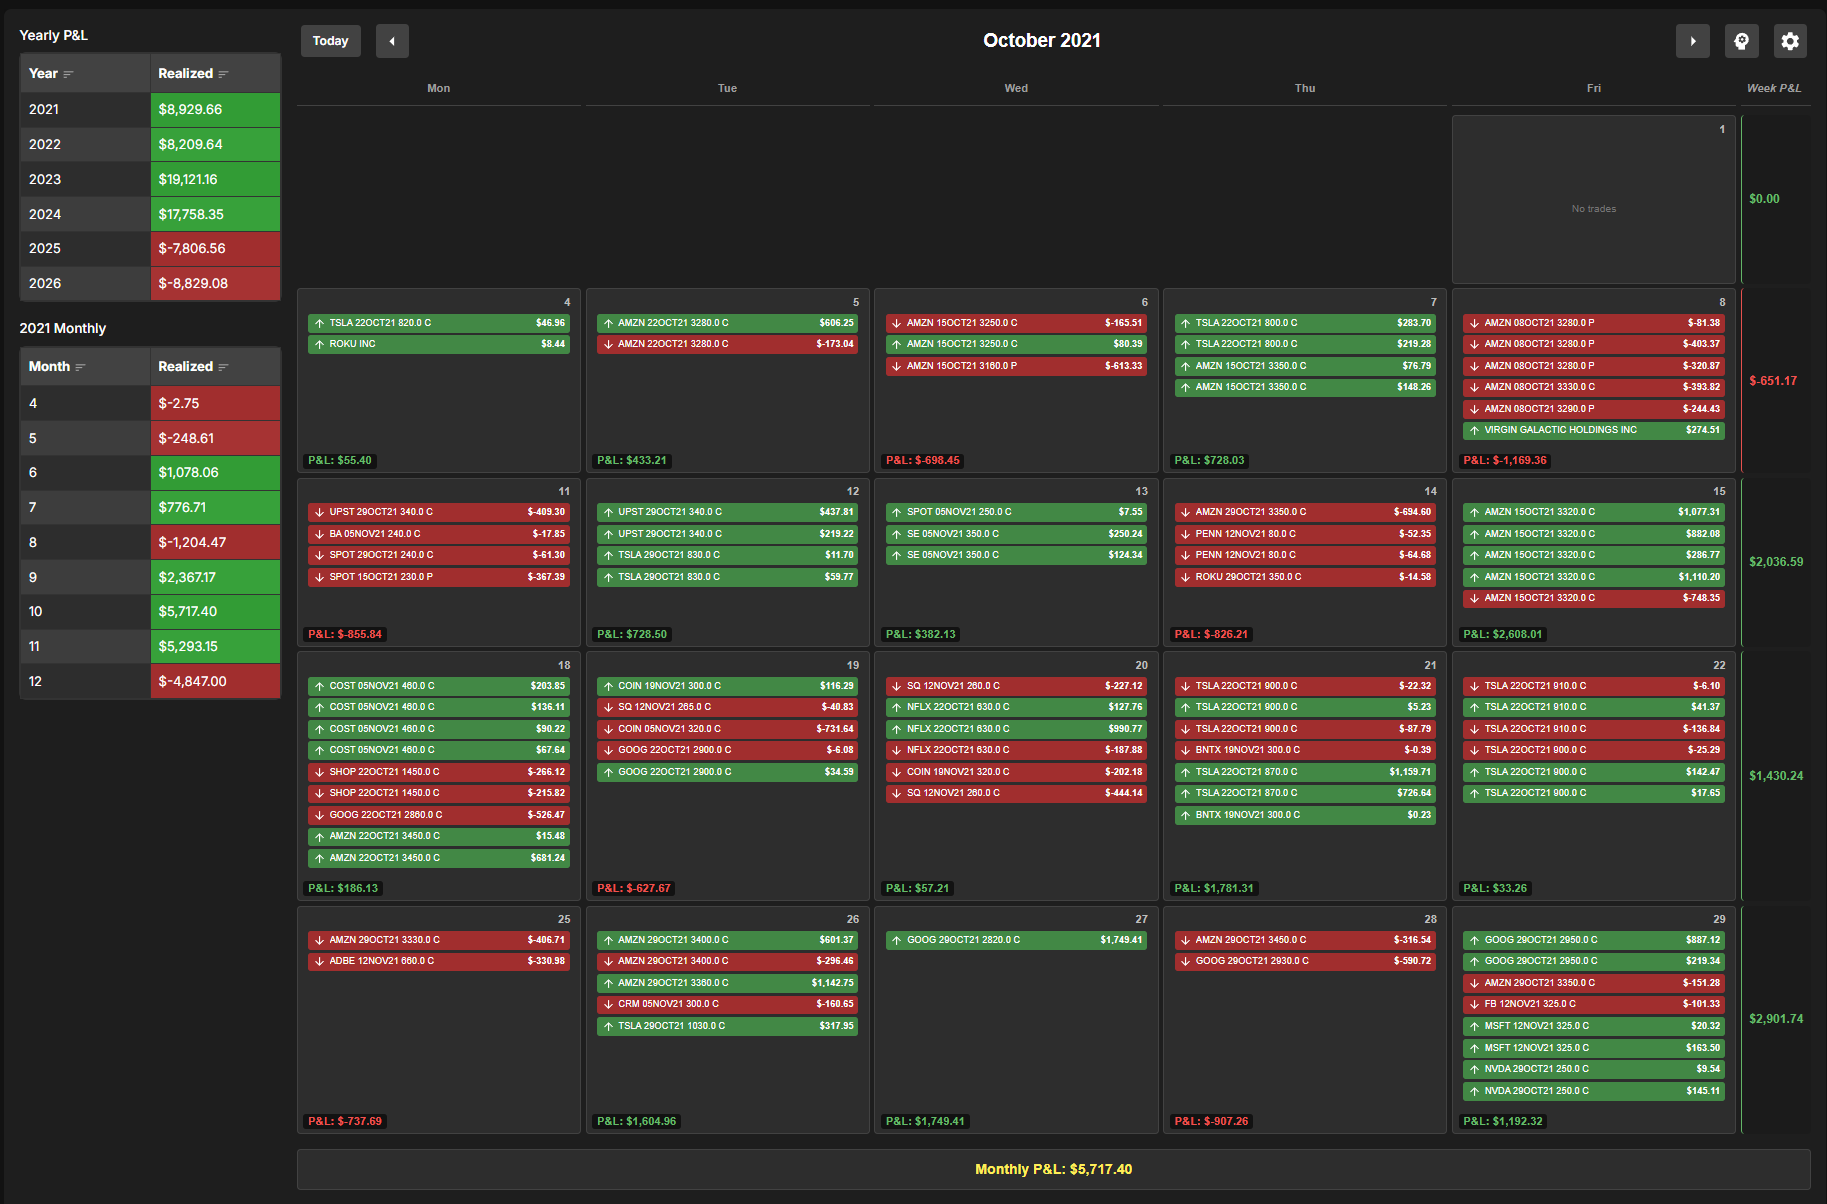
Your performance, visualized daily
Clear view of your profits by year, month, week, and day. Click any day to see detailed trade statistics and executions.
Overview
The P&L Calendar provides the ultimate visual consistency check. See your progress at a glance across different timeframes. The interactive interface lets you drill down from monthly summaries into individual sessions, making it easy to spot whether your winners are concentrated in specific days of the month or times of the week.
Key capabilities
Monthly Performance View
Daily Execution Details
Interactive Drill-down
Multi-year History
Screenshots
🌙 Dark
Dark mode — monthly heatmap at a glance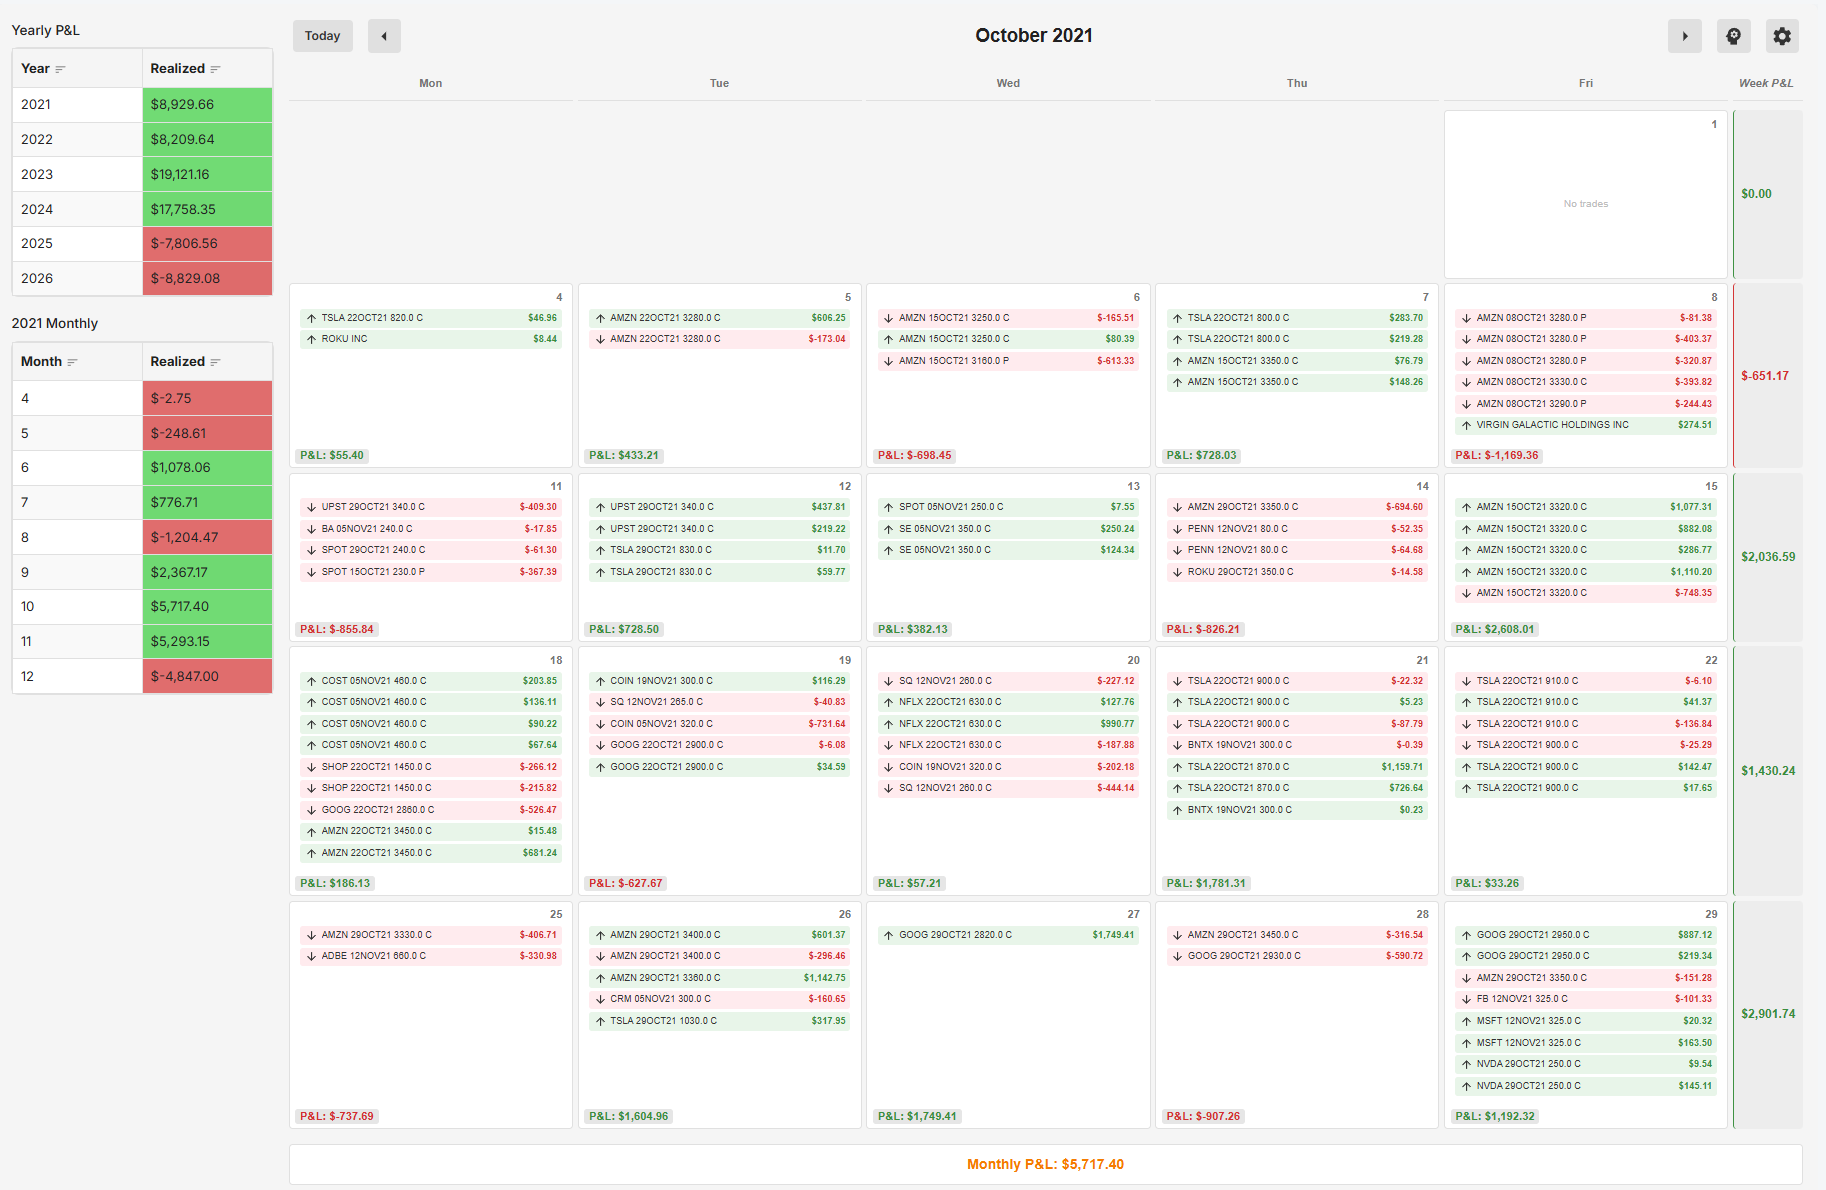
☀️ Light
Light mode — same overview, clean backgroundExplore more features
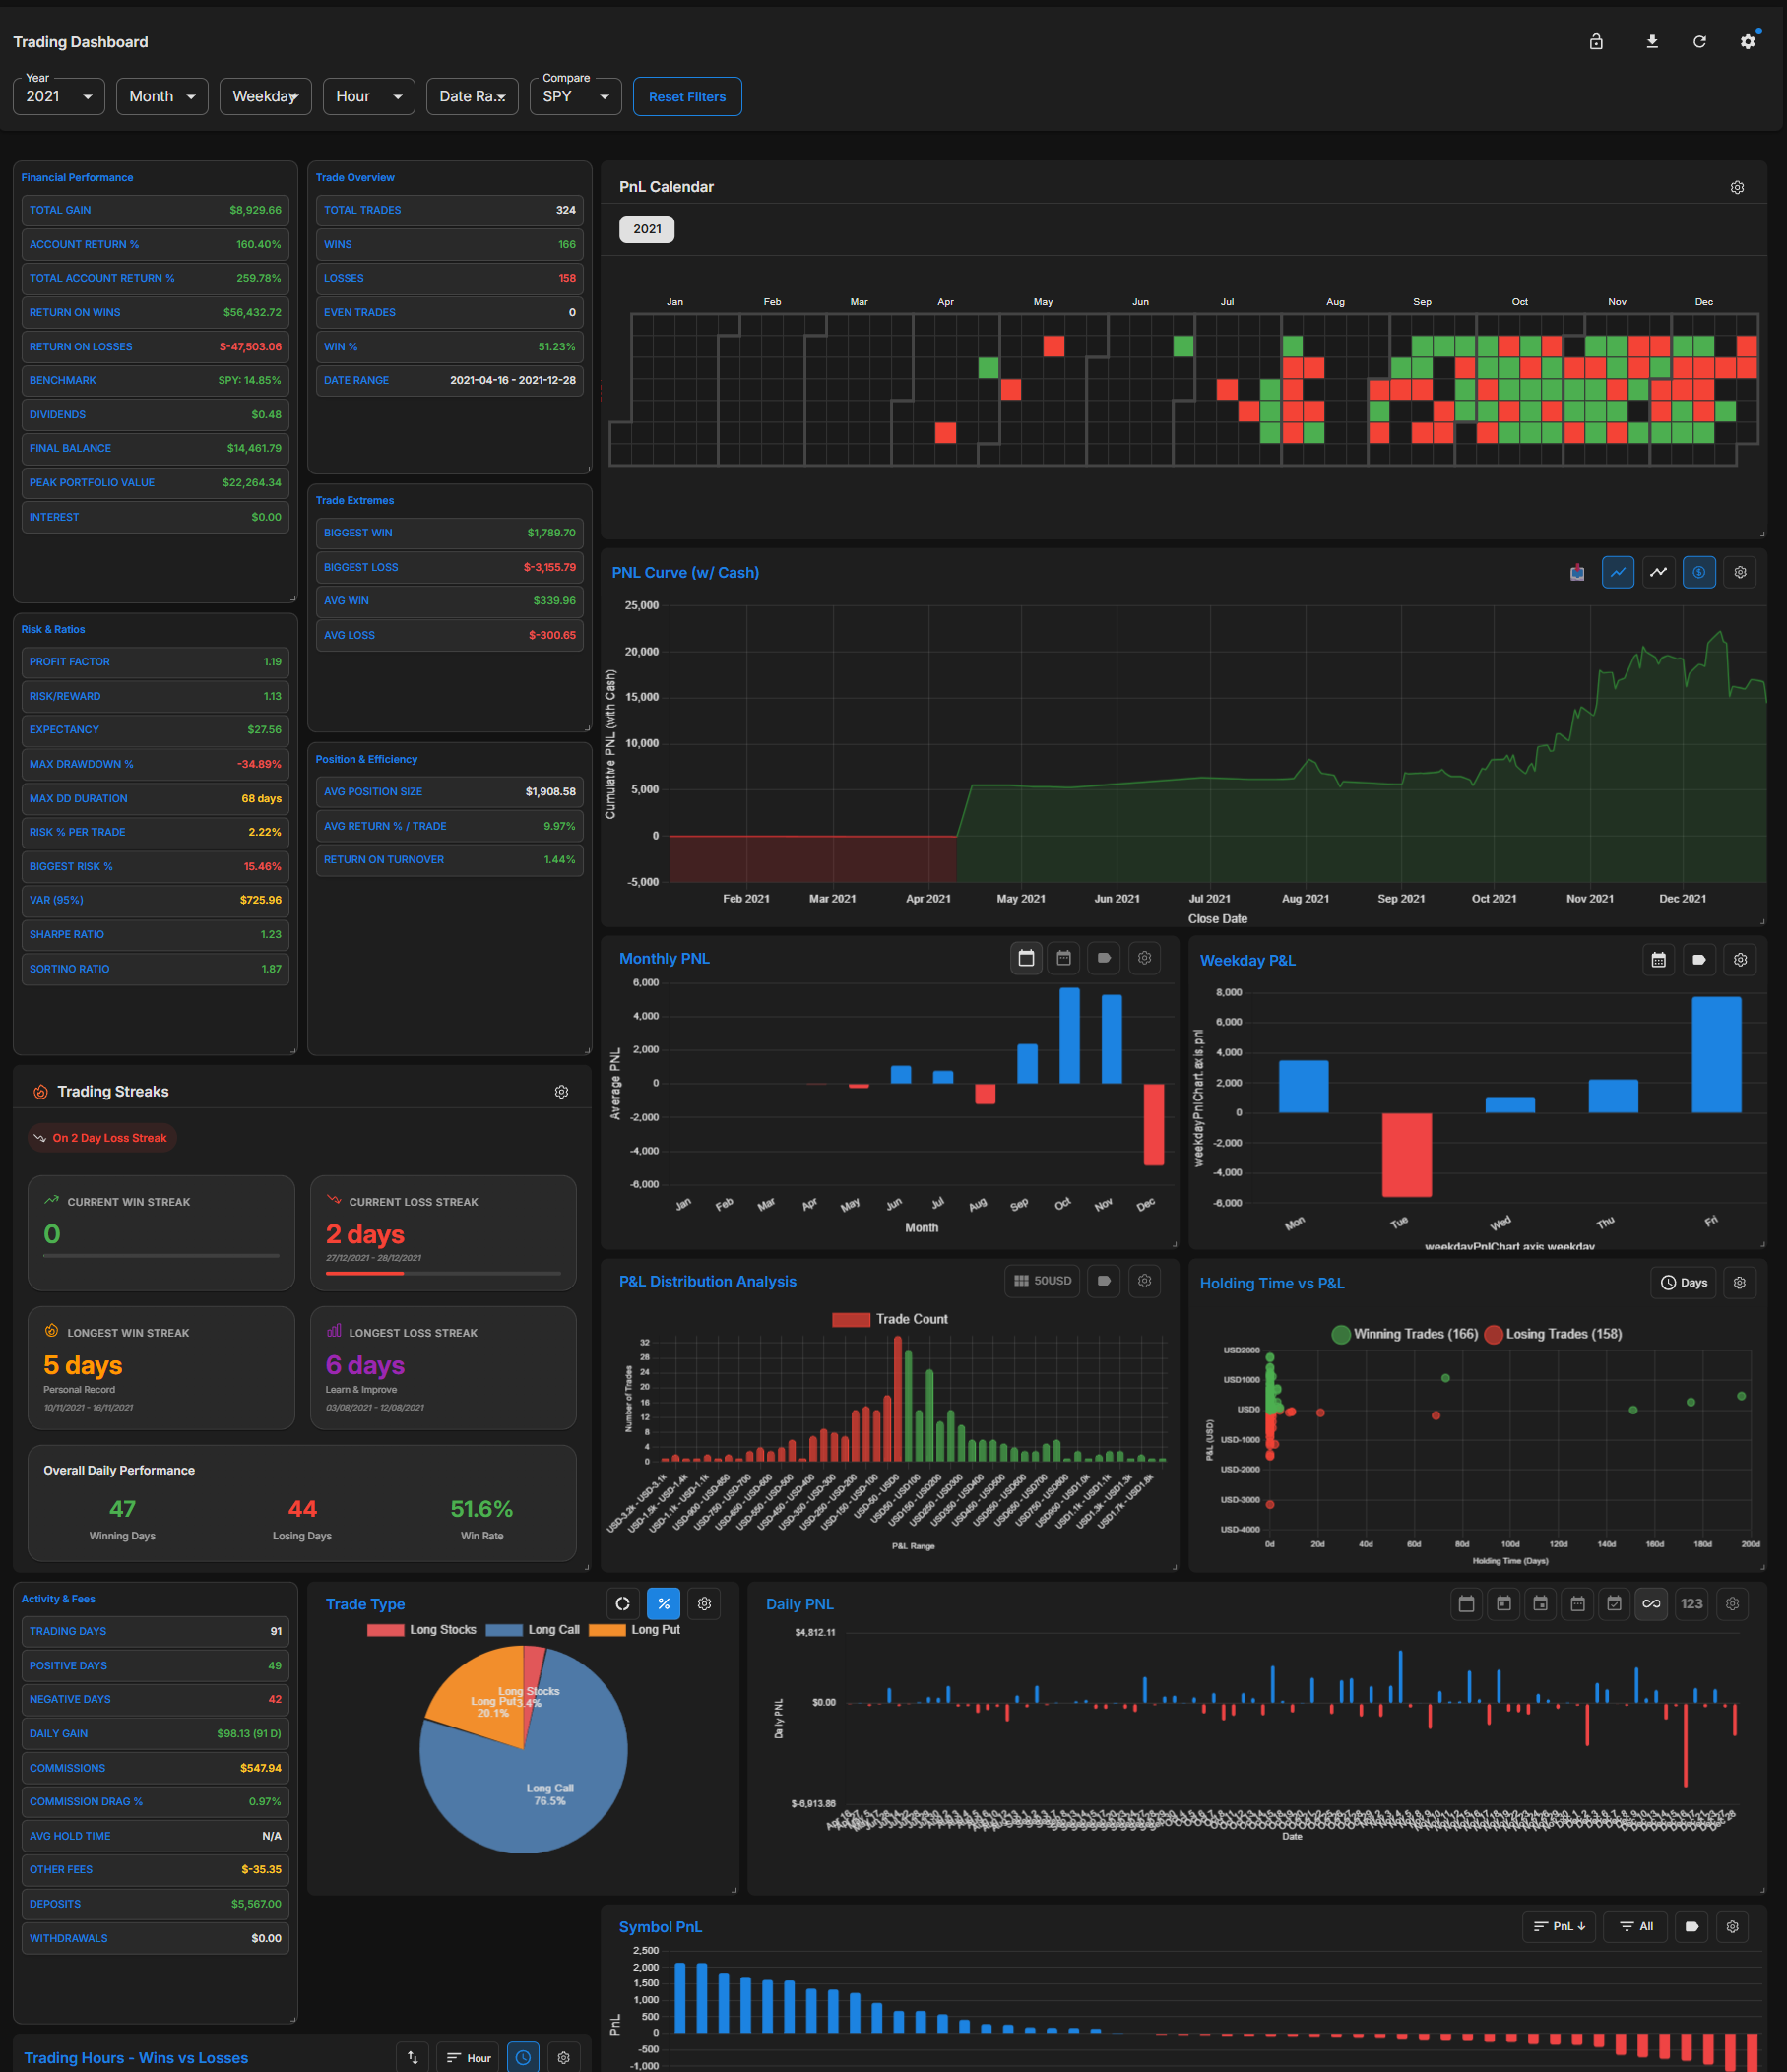
Main Dashboard
Explore
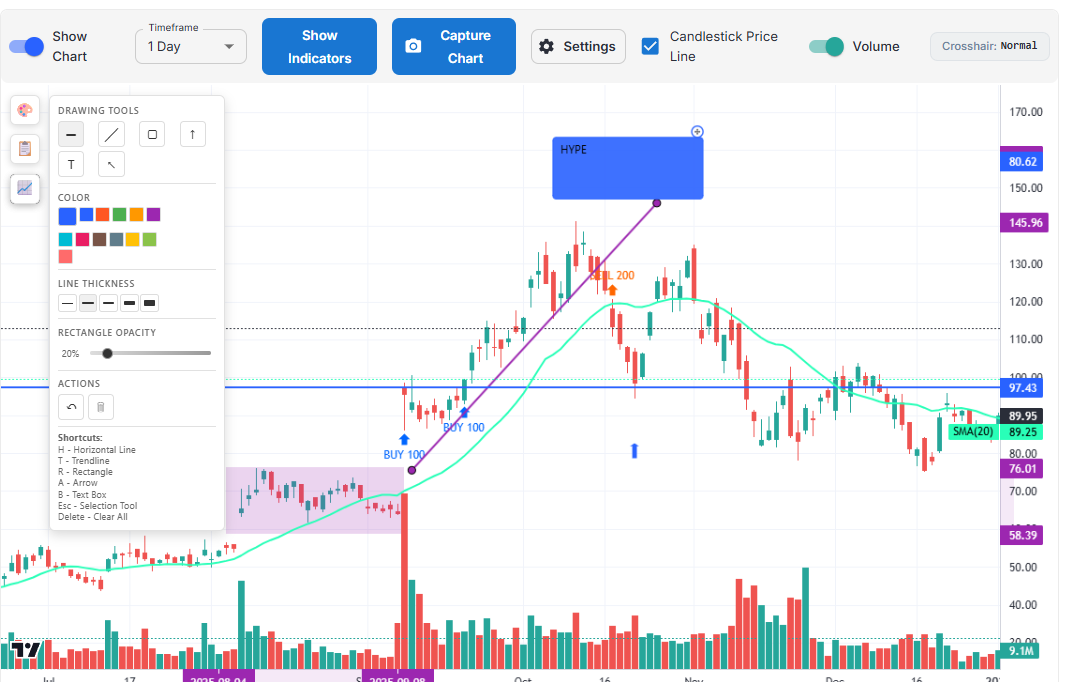
Drawing Tools
Explore
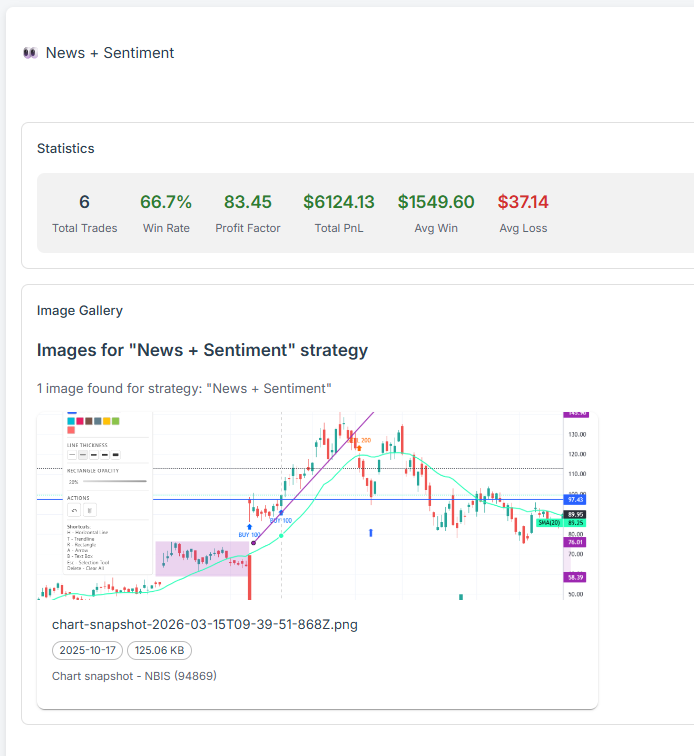
Image Gallery
Explore