CORE FEATURE
Main Dashboard
Your command center for trading excellence
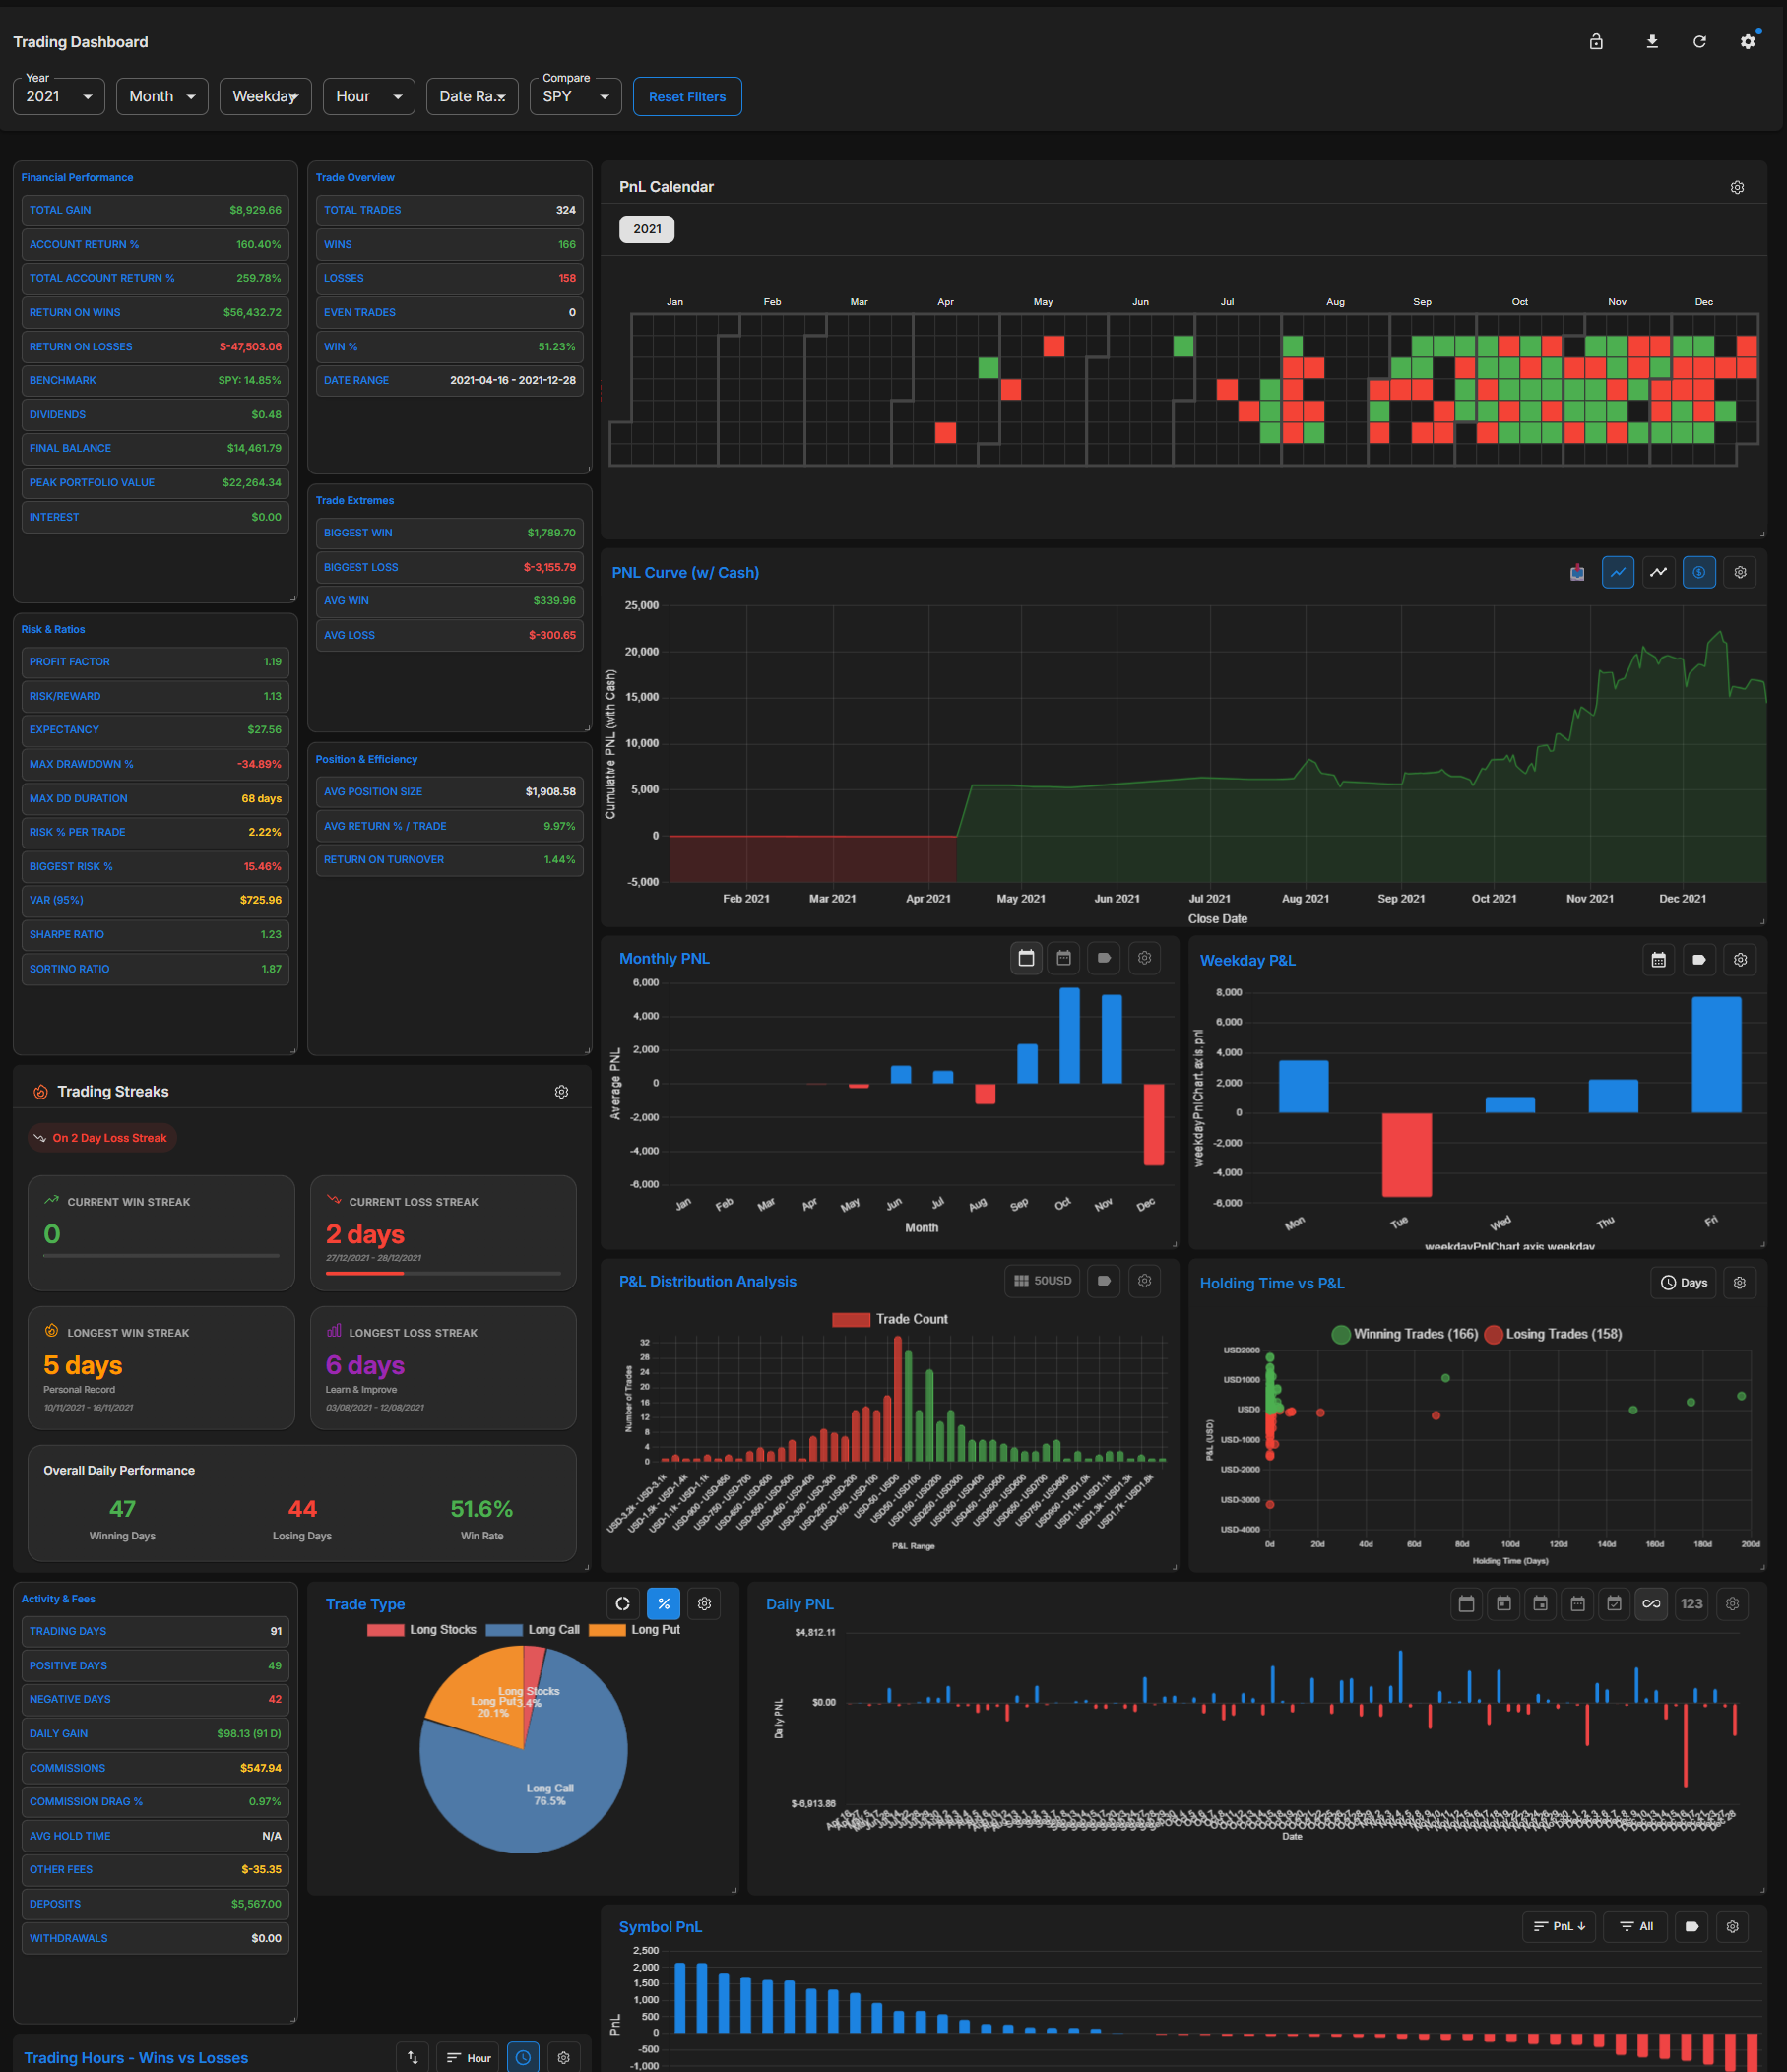
The Main Dashboard is your central hub for tracking performance. Get a bird’s-eye view of your P&L, win rates, and key metrics in one place. Customize your view to focus on what matters most for your trading style.
Overview
Take full control of your trading data with a completely customizable interface. The Main Dashboard allows you to arrange widgets, resize charts, and prioritize the metrics that align with your specific trading goals. Whether you are focusing on daily P&L or long-term equity growth, every data point is at your fingertips.
Key capabilities
Interactive Performance Charts
Customizable Layout
Real-time P&L Tracking
Multi-account Support
Screenshots
🌙 Dark
Dark mode — full performance overview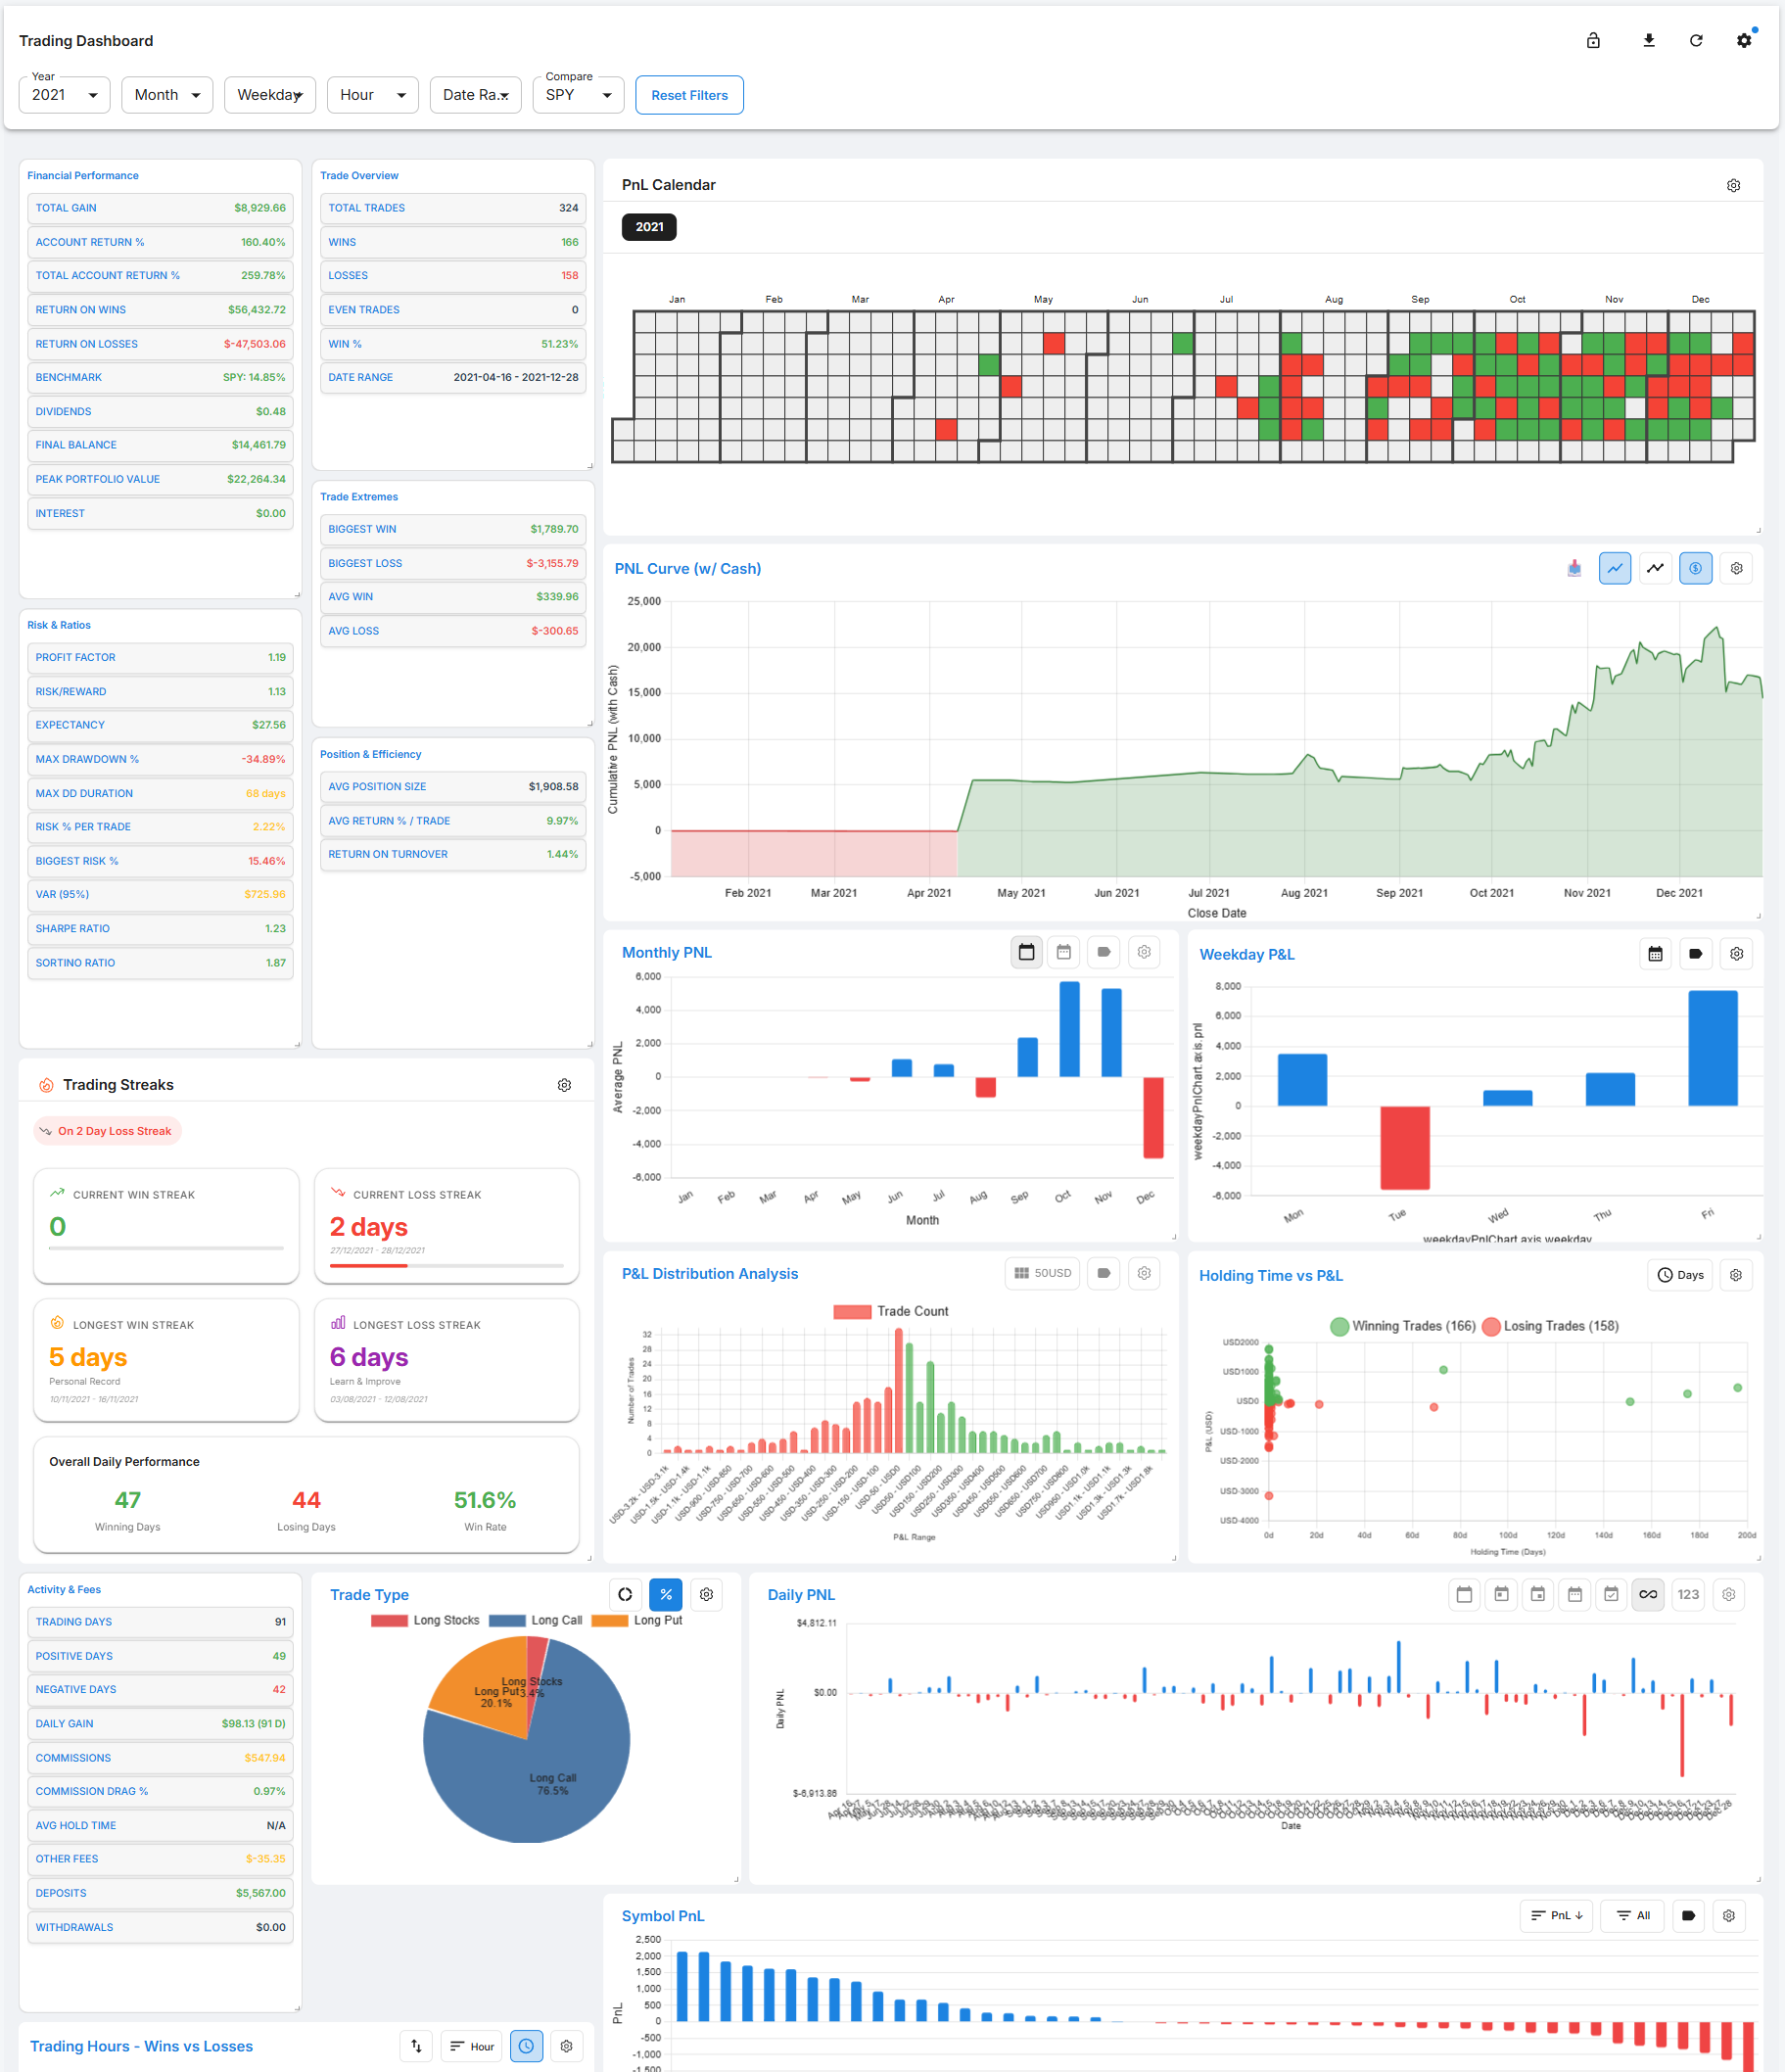
☀️ Light
Light mode — same data, clean white canvasExplore more features
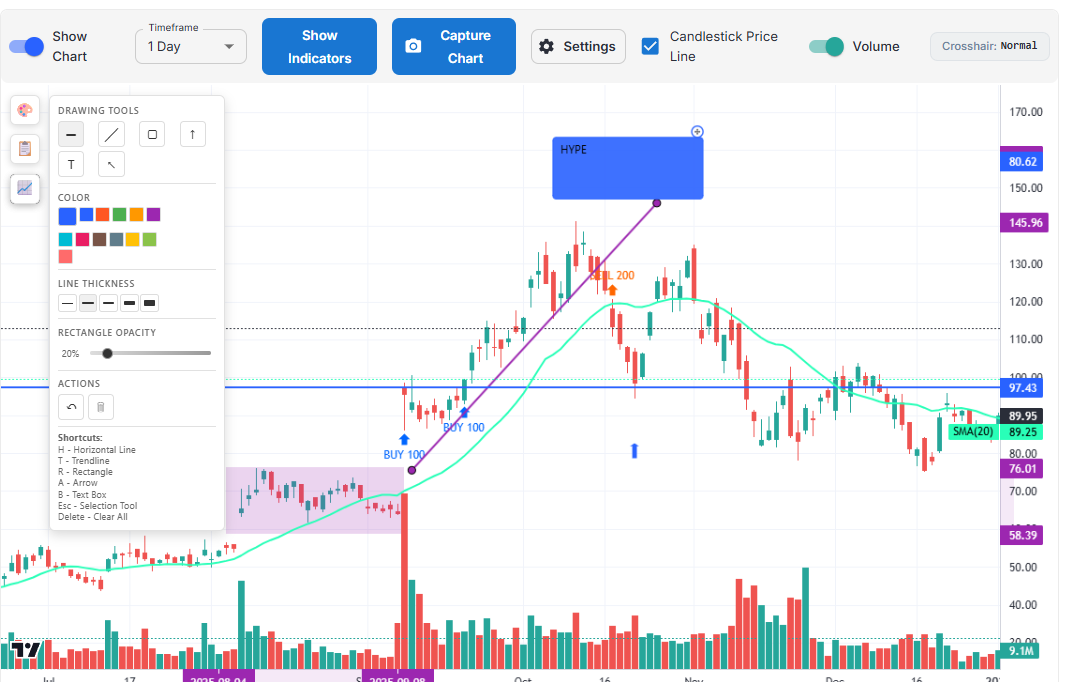
Drawing Tools
Explore
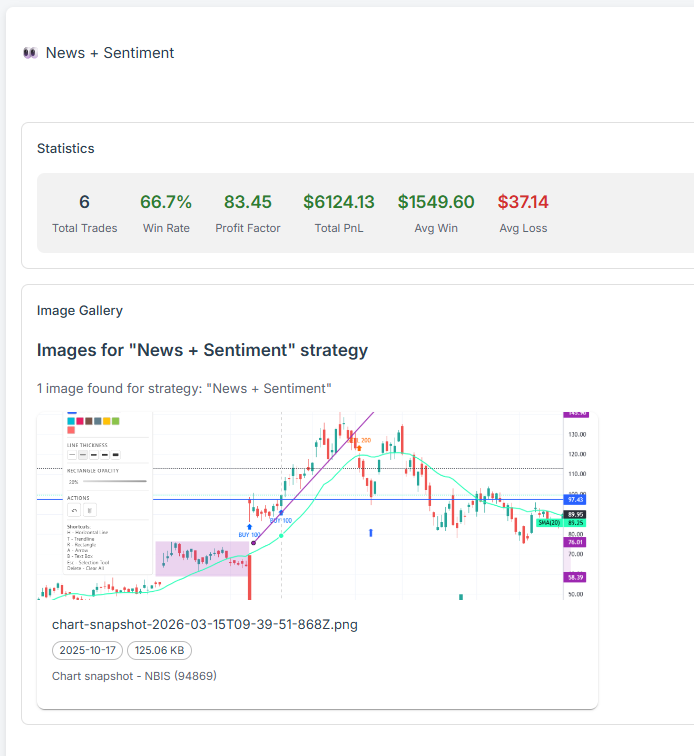
Image Gallery
Explore
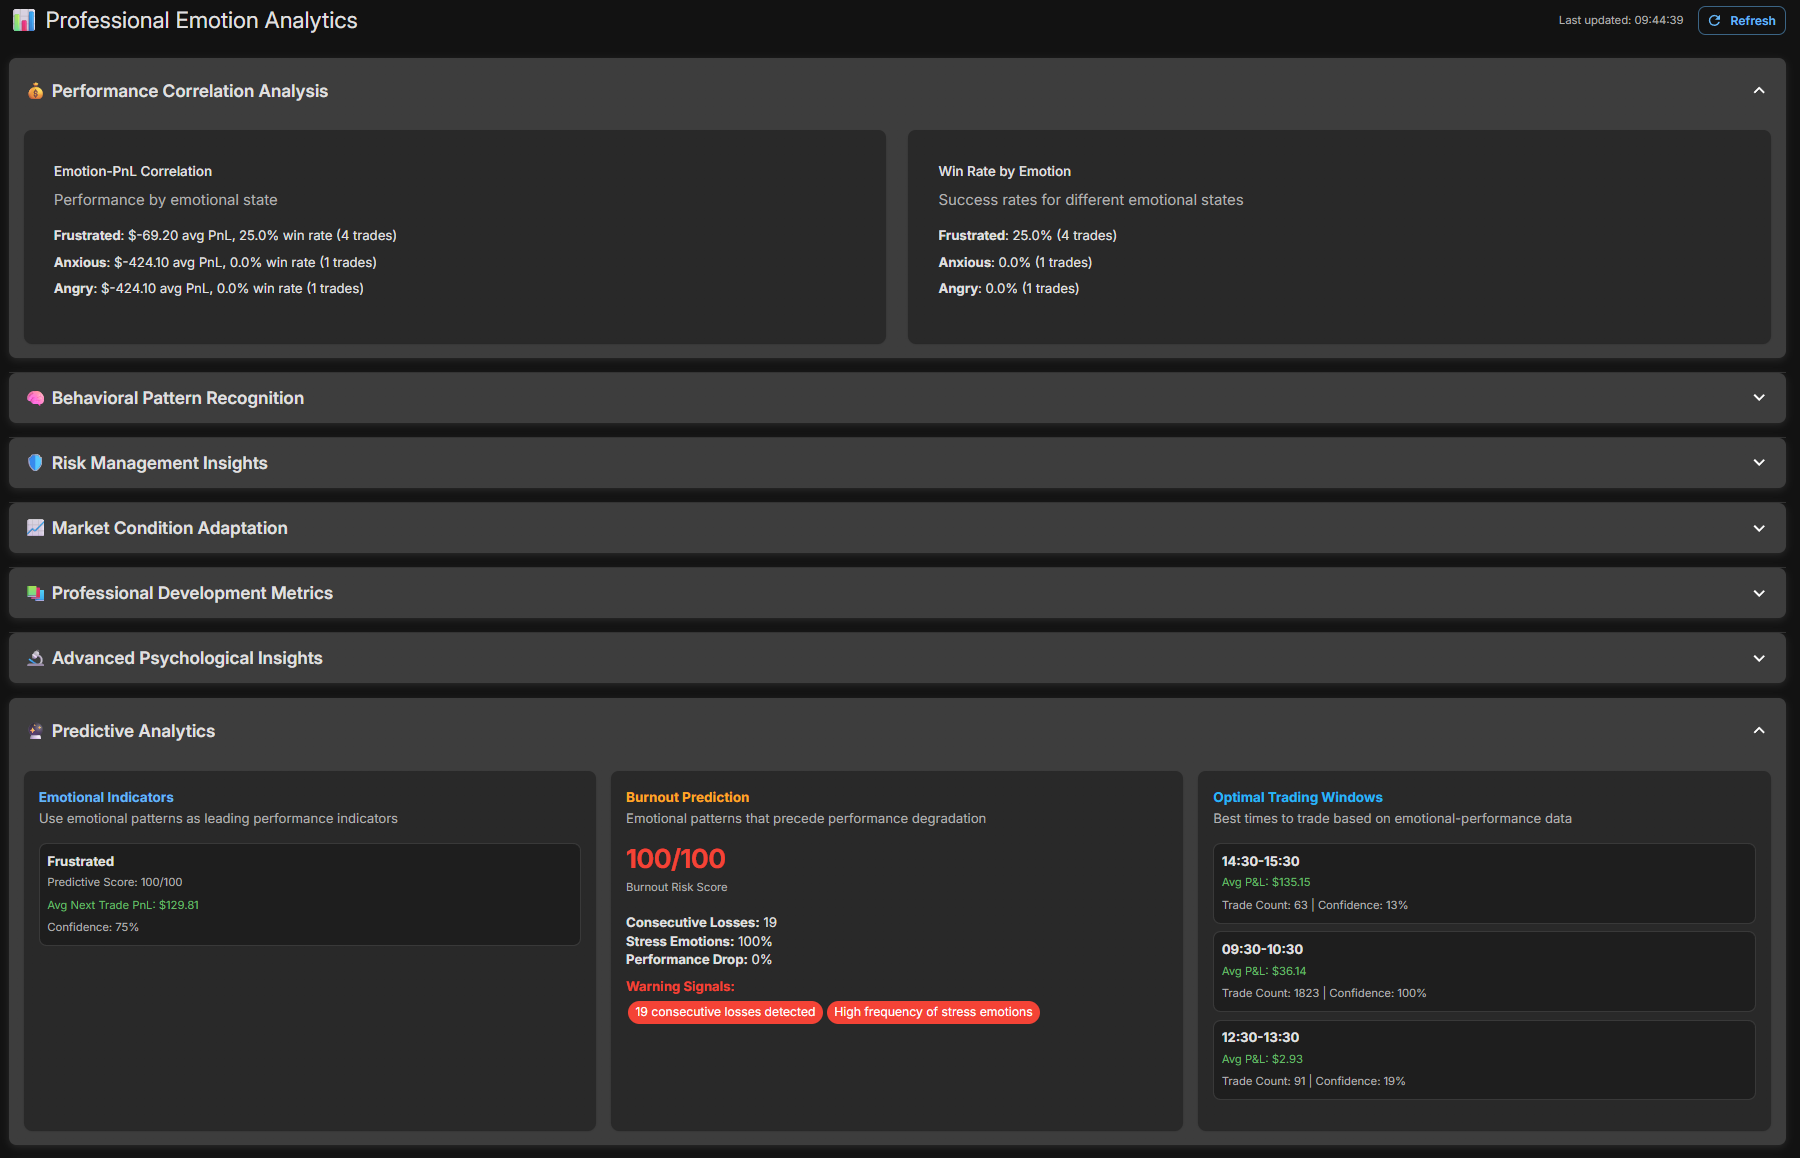
Emotion Analysis
Explore