FORTGESCHRITTEN
Advanced Analytics
Tief in Ihre Daten eintauchen
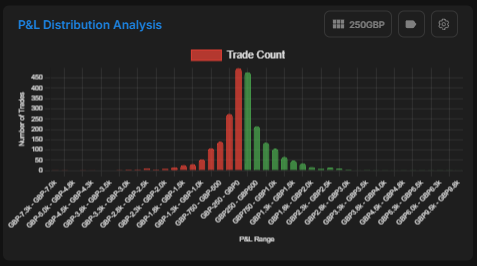
G&V-Verteilungscharts mit anpassbaren Intervallen und interaktiven Elementen.
Overview
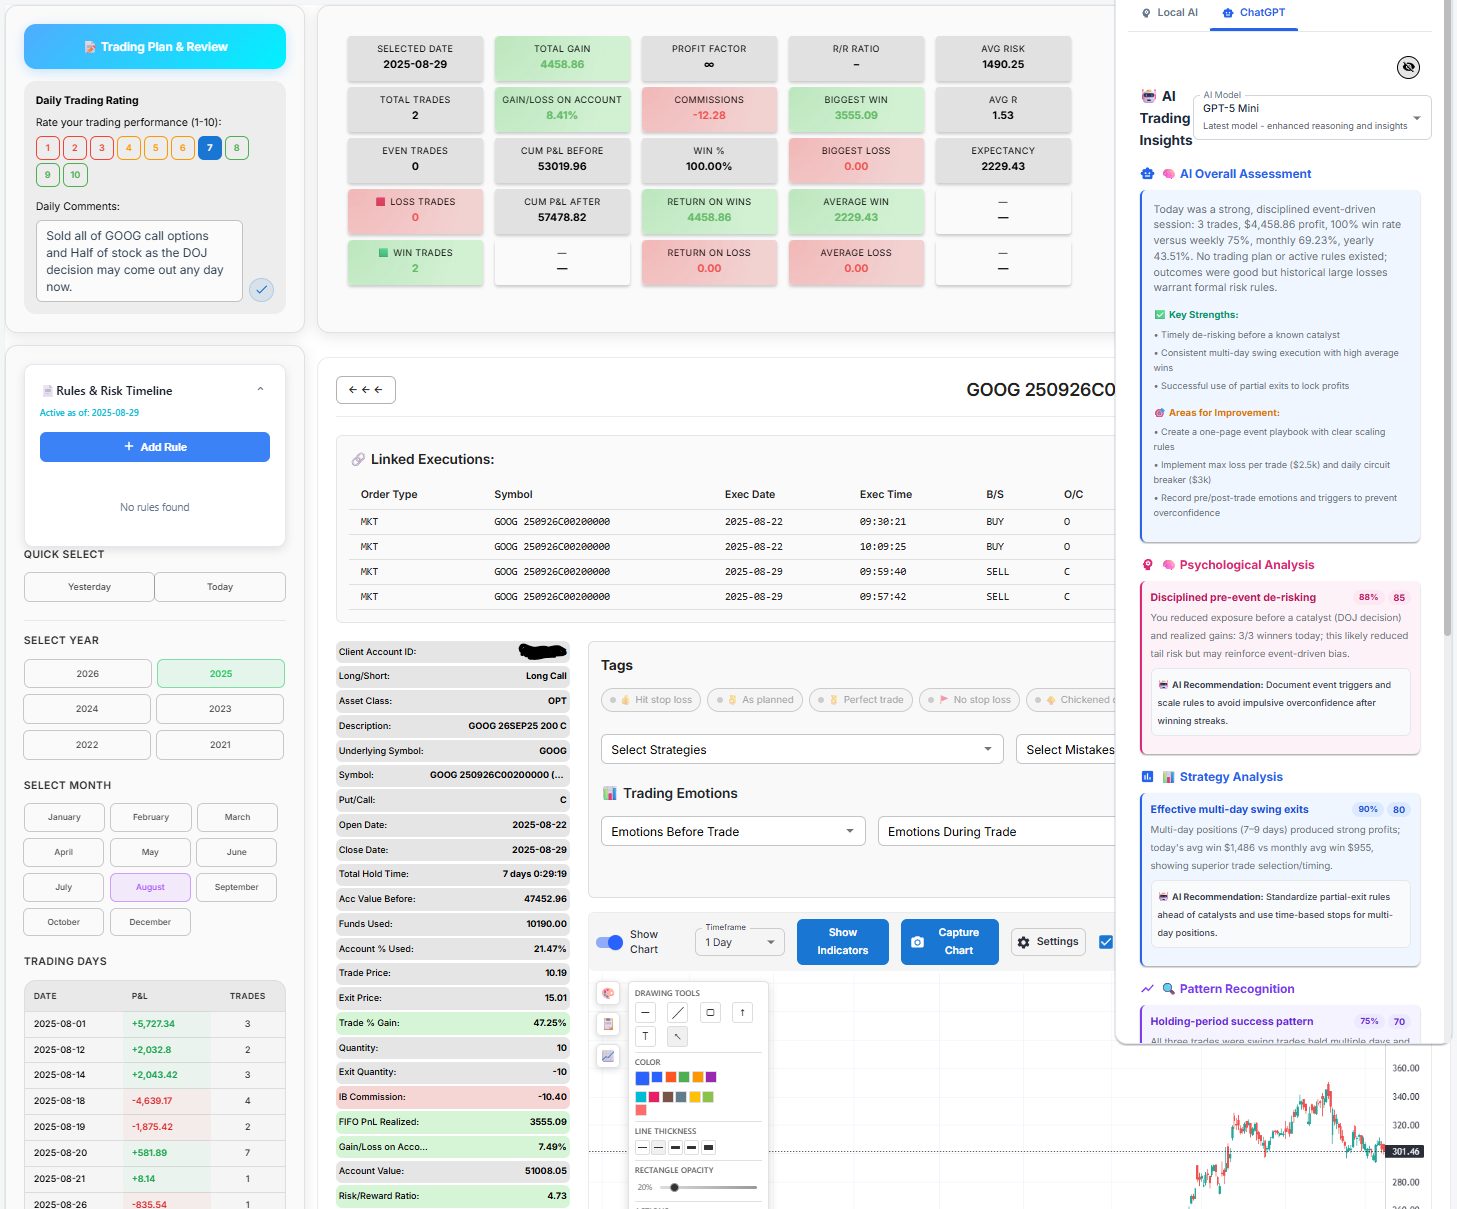
Gehen Sie über einfache Win-Ratios hinaus. Unsere Advanced Analytics Suite bietet probabilistische Einblicke. Analysieren Sie die G&V-Verteilung, Erwartungswerte und sektorspezifische Performance über verschiedene Zeitfenster.
Key capabilities
G&V-Verteilung
Tageszeit-Analyse
Sektor-Performance
Interaktives Charting
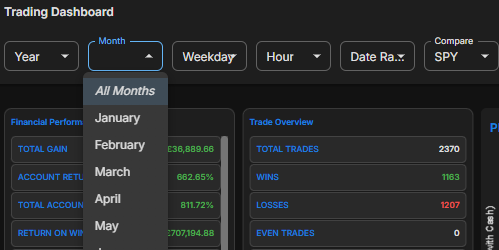
Screenshots
🌙 Dark
Dark mode — strategy comparison and distribution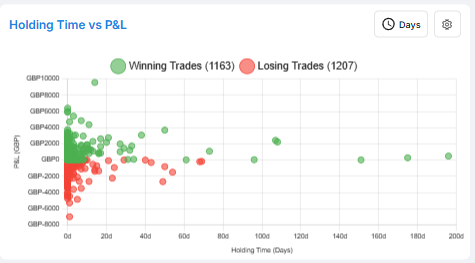
☀️ Light
Light mode — time-of-day heatmap viewExplore more features
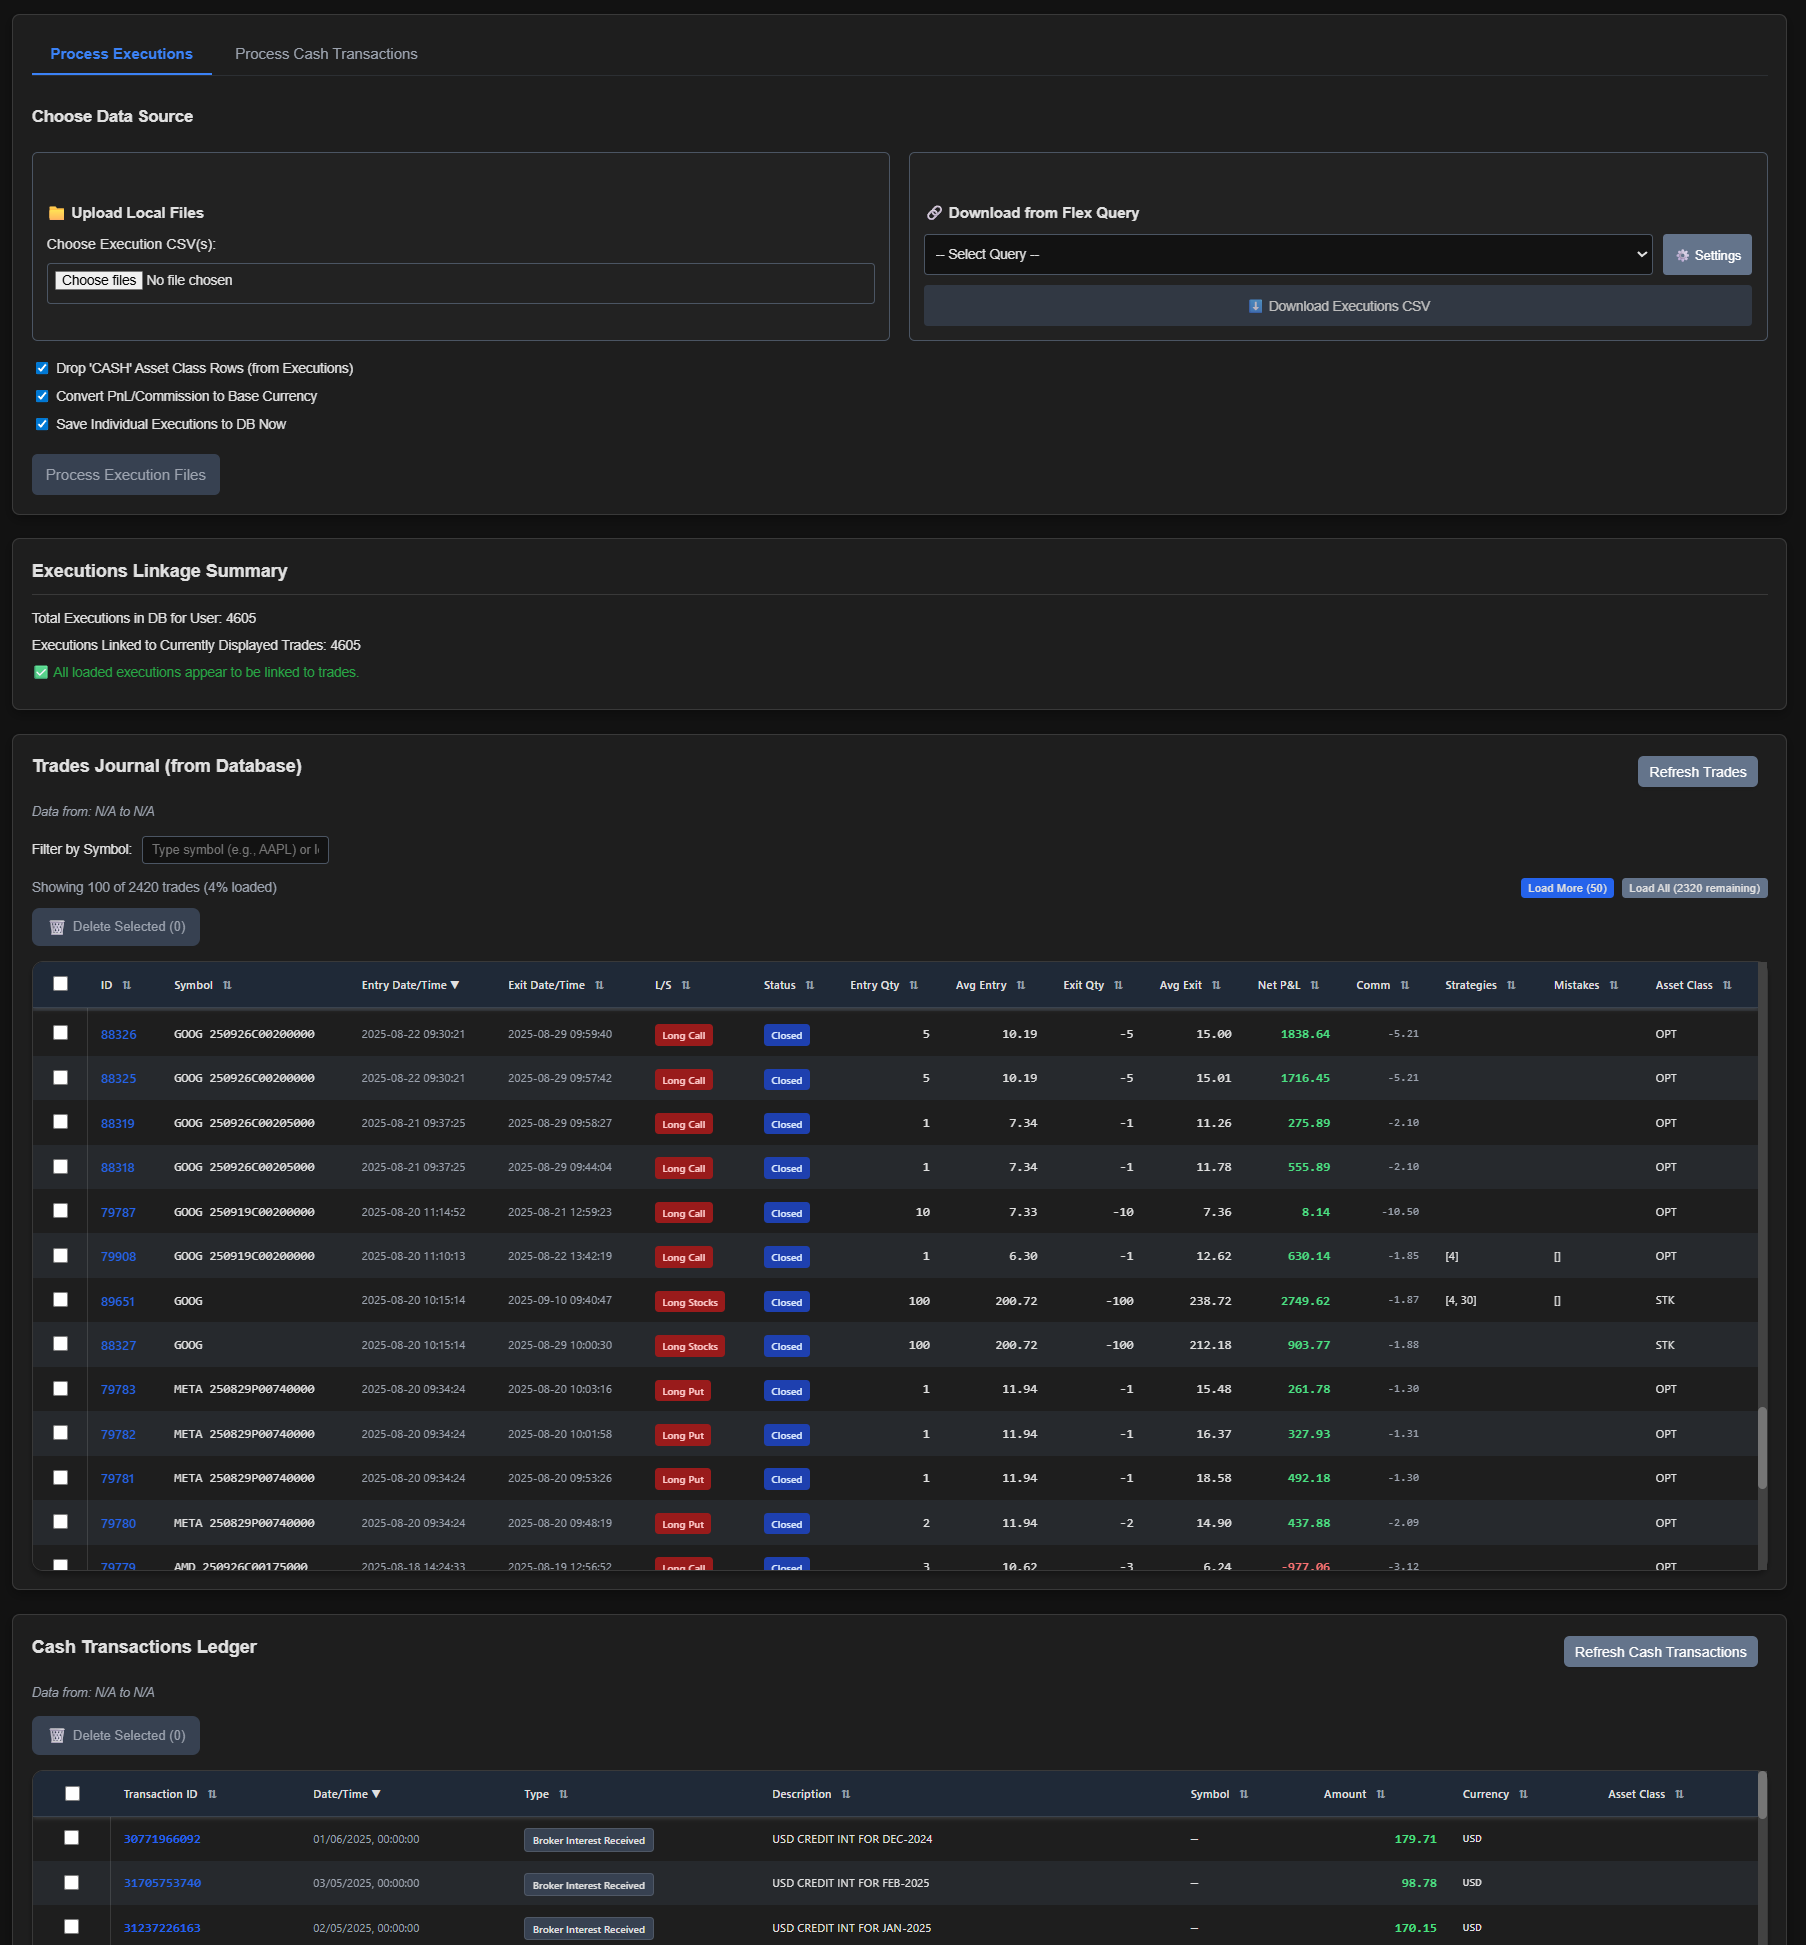
Data Import
Explore
Trade Tables
Explore
Filtering
Explore